Superkaramba desktop: differenze tra le versioni
(piccola correzione) |
(Aggiunto template autori) |
||
| Riga 221: | Riga 221: | ||
[http://dl.dropbox.com/u/3251342/karamba/mm_monitor_v1.0.tar.gz Download mm_monitor_v1.0.tar.gz] | [http://dl.dropbox.com/u/3251342/karamba/mm_monitor_v1.0.tar.gz Download mm_monitor_v1.0.tar.gz] | ||
{{Autori | |||
|Autore = [[Utente:Mm-barabba|Mm-barabba]] 16:31, 16 gen 2011 (CET)] | |||
|Verificata_da = | |||
|Estesa_da = | |||
|Numero_revisori = 1 | |||
}} | |||
[[Categoria:Kde]] | [[Categoria:Kde]] | ||
Versione delle 05:18, 13 set 2012
| ATTENZIONE Alcune righe riportavano comandi lunghi che per problemi in fase di stampa ho ridotto mandando a capo. Prestate attenzione o scaricate a fondo pagina il file .theme corretto |
Il nostro primo tema
Per lo sviluppo del nostro primo tema cominceremo con il preparare alcune immagini, come quella indispensabile dello sfondo.
Poi sarà necessario impostare un carattere di default e le impostazioni generali.
karamba x=0 y=0 w=250 h=80 locked=true
#Default font and color:
defaultfont font="DeJavu Serif" fontsize=10 color=255,255,255 shadow=0

#Background
image x=0 y=0 path="image/bg.png"
Informazioni generali
Cominciamo a inserire le righe che ci forniranno le impostazioni generali del sistema:
# General System info:
<group> x=0 y=0
image x=23 y=32 path="image/logo.png"
text x=79 y=30 value="Kernel:"
text x=120 y=30 sensor=program program="uname -r"
text x=79 y=44 value="Debian:"
text x=119 y=44 sensor=program program="cat /etc/debian_version"
text x=79 y=58 value="KDE Version:"
text x=148 y=58 sensor=program program="kde4-config --version | grep KDE | sed -e 's/.*: //' |  sed -e 's/(KDE .*)//'"
text x=79 y=72 value="Uptime:"
text x=120 y=72 sensor=uptime format="%dd : %Hh : %Mm" interval=300000
</group>
Potete provare direttamente i comandi da shell per capire gli output, e se vi pare arabo imparate altrimenti fate come me che copio un pò da quelli che provo e mi piacciono.
La CPU
Per aggiungere la CPU e i dati relativi sarà necessario operare alcune modifiche a priori.
La lunghezza sarà da modificare come l'immagine di sfondo in base alle nostre esigenze .
Sara poi il momento di inserire le nuove righe.
# CPU model:
<group> x=0 y=90
text x=27 y=10 value="Processsore:" fontsize=10
image x=20 y=32 path="image/cpu1.png"
#
text x=14 y=30 sensor=program program="cat /proc/cpuinfo |grep 'model name'|cut -c 14-36" fontsize=9
text x=63 y=43 value="Usage :"
text x=63 y=53 value="User :"
text x=63 y=63 value="System :"
text x=135 y=43 sensor=cpu cpu=0 format="%v%" interval=2000 color=35,210,255 align=right
text x=135 y=53 sensor=cpu cpu=0 format="%user%" interval=2000 color=color=0,200,0 align=right
text x=135 y=63 sensor=cpu cpu=0 format="%system%" interval=2000 color=240,60,0 align=right
#
graph x=143 y=35 w=82 h=50 sensor=cpu points=100 color=35,210,255 cpu=0
graph x=143 y=35 w=82 h=50 points=100 color=0,200,0 sensor=cpu format="%user" cpu=0
graph x=143 y=35 w=82 h=50 points=100 color=220,0,0 sensor=cpu format="%system" cpu=0
image x=143 y=35 path="image/fcpu2.png"
#
text x=60 y=75 value="MHz :"
text x=108 y=75 sensor=program program="lscpu |grep MHz |cut -c 24-27" interval=300000
</group>
In questo caso il grafico che è modificabile, tiene traccia del carico della CPU totale,system e user.
Nel caso vi siano più CPU è possibile inserire i valori in più grafici diversi oppure in un grafico solo.
Alcune Temperature
# Temperatures and fans.
<group> x=0 y=185
text x=27 y=0 value="Temperature:" fontsize=10
image x=23 y=23 path="image/temp.png"
#
text x=69 y=21 value="CPU :"
text x=108 y=21 sensor=program program="sensors -u | grep temp1_input | sed -e 's/.*: //'|cut -c 1-2" line=1 interval=2000 align=left
text x=121 y=21 value=" °C"
bar x=145 y=24 path="image/bgs80.png" min=35 max=70 sensor=program program="sensors -u | grep temp1_input | sed -e 's/.*: //'|cut -c 1-2" line=1 interval=2000
image x=145  y=24 path="image/bg80.png"
#
text x=69 y=35 value="CPU Fan:"
#questa riga restituisce l'output reale della ventola
#text x=125 y=35 sensor=program program="sensors -u | grep fan1_input | sed -e 's/.*: //'" line=1 interval=1000 align=left
# questa sotto da me modificata restituisce un'output dimezzato, perchè la mia ventola con potenziometro viene riconosciuta
#al doppio dei giri reali .
text x=125 y=35 sensor=program program="sensors -c /dev/null | awk '/fan1:/ {print $2/2}'|cut -c 1-4 " line=1 interval=2000 align=left
text x=152 y=35 value=" rpm"
#
text x=69 y=49 value="Nvidia :"
text x=108 y=49 sensor=program program="nvidia-settings -q GPUCoreTemp | grep 0.0 | sed -e 's/.*: //'| cut -c 1-2" line=1 interval=2000 align=left
text x=121 y=49 value=" °C"
bar x=145 y=52 path="image/bgs80.png" min=35 max=70 sensor=program program="nvidia-settings -q GPUCoreTemp | grep 0.0 | sed -e 's/.*: //'| cut -c 1-2" line=1 interval=2000
image x=145  y=52 path="image/bg80.png"
#
</group>
Per le temperature pare che per ora gli unici driver che restituiscano un'output siano gli ATI e gli NVidia propietari.
Per esagerare ho aggiunto due barre con limite di temperatura da 35° a 70° che mi sembrano limiti normali di utilizzo, queste non sono indispensabili ma mi appagano l'occhio.
La Rete
# Network section
<group> x=0 y=255
text x=27 y=0 value="Network :" fontsize=10
image x=20 y=24 path="image/net3.png"
#
text x=70 y=19 value="Local IP:"
text x=145 y=19 sensor=program program="/sbin/ifconfig eth1 | grep 'inet ' | cut -d : -f2 | cut -d ' ' -f1" interval=300000
#
text x=70 y=36 value="External IP:"
text x=145 y=36 sensor=program program="rm -rf .jftgwh ; mkdir .jftgwh ; cd .jftgwh ; wget http://checkip.dyndns.org/index.html && cat index.html | cut -d ' ' -f 6 | cut -d '<' -f 1 ; cd .. ; rm -rf .jftgwh" align=left interval=300000
# Speeds
text x=40 y=57 value="Download:"
text x=100 y=57 sensor=network device="eth1" format="%in KB/s" interval=2000 decimals=2 color=1,247,1
text x=160 y=57 color=1,247,1 sensor=program program="/sbin/ifconfig eth1 | grep 'RX byte' | awk '{print $3 $4}'" interval=5000
#
text x=40 y=72 value="Upload:"
text x=100 y=72 sensor=network device="eth1" format="%out KB/s" interval=2000 decimals=2 color=240,90,90
text x=160 y=72 color=240,90,90 sensor=program program="/sbin/ifconfig eth1 | grep 'TX byte' | awk '{print $7 $8}'" interval=5000
</group>
Per la rete di un PC desktop perennemente collegato a un router ho scelto le infomrazioni di base.
Gli HD
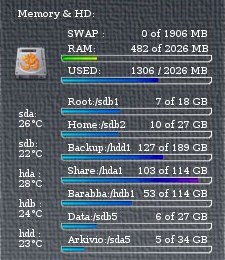
smatmontools - hddtemp
# Memory , HD,RAM, HDD and Swap
<group> x=0 y=350
text x=29 y=-0 value="Memory & HD:" fontsize=10
image x=24 y=39 path="image/hdd3.png"
#
text x=79 y=20 value="SWAP :" fontsize=10
#text x=142 y=20 sensor=memory format="%um / %tm MB" interval=3000
text x=153 y=20 sensor=memory format="%us of %ts MB"
#
text x=79 y=35 value="RAM:"
text x=142 y=35 sensor=memory format="%umb of %tm MB" interval=2000
bar  x=72  y=49 path="image/barload1.png" sensor=memory format="%umb" interval=8000
image x=70  y=46 path="image/barlines.png"
#
text x=79 y=57 value="USED:"
text x=180 y=57 sensor=memory format="%um / %tm MB" interval=3000 align=center
bar  x=72 y=71 path="image/barload.png" sensor=memory format="%um" interval=8000
image x=70  y=68 path="image/barlines.png"
#
text x=79 y=88 value="Root:/sdb1"
text x=219 y=88 sensor=disk format="%ug of %tg GB" mountpoint="/" interval=8000 align=right
bar x=72 y=102 path="image/barload.png" sensor=disk mountpoint="/" interval=8000
image x=70 y=99 path="image/barlines.png"
#
text x=79 y=111 value="Home:/sdb2"
text x=219 y=111 sensor=disk format="%ug of %tg GB" mountpoint="/home" interval=8000 align=right
bar x=72 y=125 path="image/barload.png" sensor=disk mountpoint="/home" interval=8000
image x=70 y=122 path="image/barlines.png"
#
</group>
#HDD Temp
<group> x=0 y=380
text x=30 y=70 value="sda:"
text x=30 y=80 sensor=program program="hddtemp /dev/sda | grep °C | sed -e 's/.*: //'" line=1 interval=5000 align=left
#
text x=30 y=100 value="sdb:"
text x=30 y=110 sensor=program program="hddtemp /dev/sdb | grep °C | sed -e 's/.*: //'" line=1 interval=5000 align=left
#
</group>
Con questa parte mi sono sbizzarrito ad inserire le diverse partizioni dei miei 5 HD e le relative temperature.
Se la temperatura non venisse rilevata verificare che hddtemp sia installato e abilitato per l'utente.
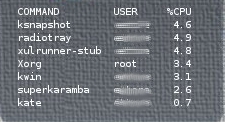
I processi
#Processi
<group> x=28 y=538
    text x=1 y=0  sensor=program program="ps axo comm,user,pcpu --sort=-pcpu | head -n 8" font
size=10 font=monospace interval=5000
    </group>
#
Risultato
Il risultato copre tutte le mie esigenze e giocando con il tempo degli intervalli sono riuscito a mantenere i dati interessanti aggiornati con una certa frequenza, il tutto per ridurre l'uso della CPU nel generare output di aggiornamento.
Note
Per realizzare il segunete tema mi sono affidato come base al tema 126436-Kmonitor, a cui poi ho fatto diverse modifiche grafiche e stilistiche.
Consiglio a tutti di provare diversi temi e prendere da ognuno quel che si ritiene utile.
Un pò di allenamento e una buona base da cui partire alleggerirà il lavoro.
Download mm_monitor_v1.0.tar.gz
| Guida scritta da: Mm-barabba 16:31, 16 gen 2011 (CET)] |  Debianized 20% Debianized 20%
|
| Estesa da: | |
| Verificata da: | |
|
Verificare ed estendere la guida | Cos'è una guida Debianized | |


